A daily review of the previous day's stock options activity (volume, open interest, implied volatility, and value) for the S&P 500
Graphs are updated to the previous day before market open
Scroll down to view various analyses
Graphs are updated to the previous day before market open
Scroll down to view various analyses
Stocks used
S&P 500
Total types of contracts traded
| Calls | Puts | Total | |
| - | - | - | |
| ATM & OTM | - | - | |
| ITM | - | - |

| Contracts Traded During Last Session | Calls | Puts | Total |
| Total volume | - | - | - |
| ATM & OTM | - | - | |
| ITM | - | - | |
| Total value | - | - | - |
| ATM & OTM | - | - | |
| ITM | - | - | |
|
Total value of open interestNumber of positions still held per contract type remaining |
- | - | - |
| ATM & OTM | - | - | |
| ITM | - | - |
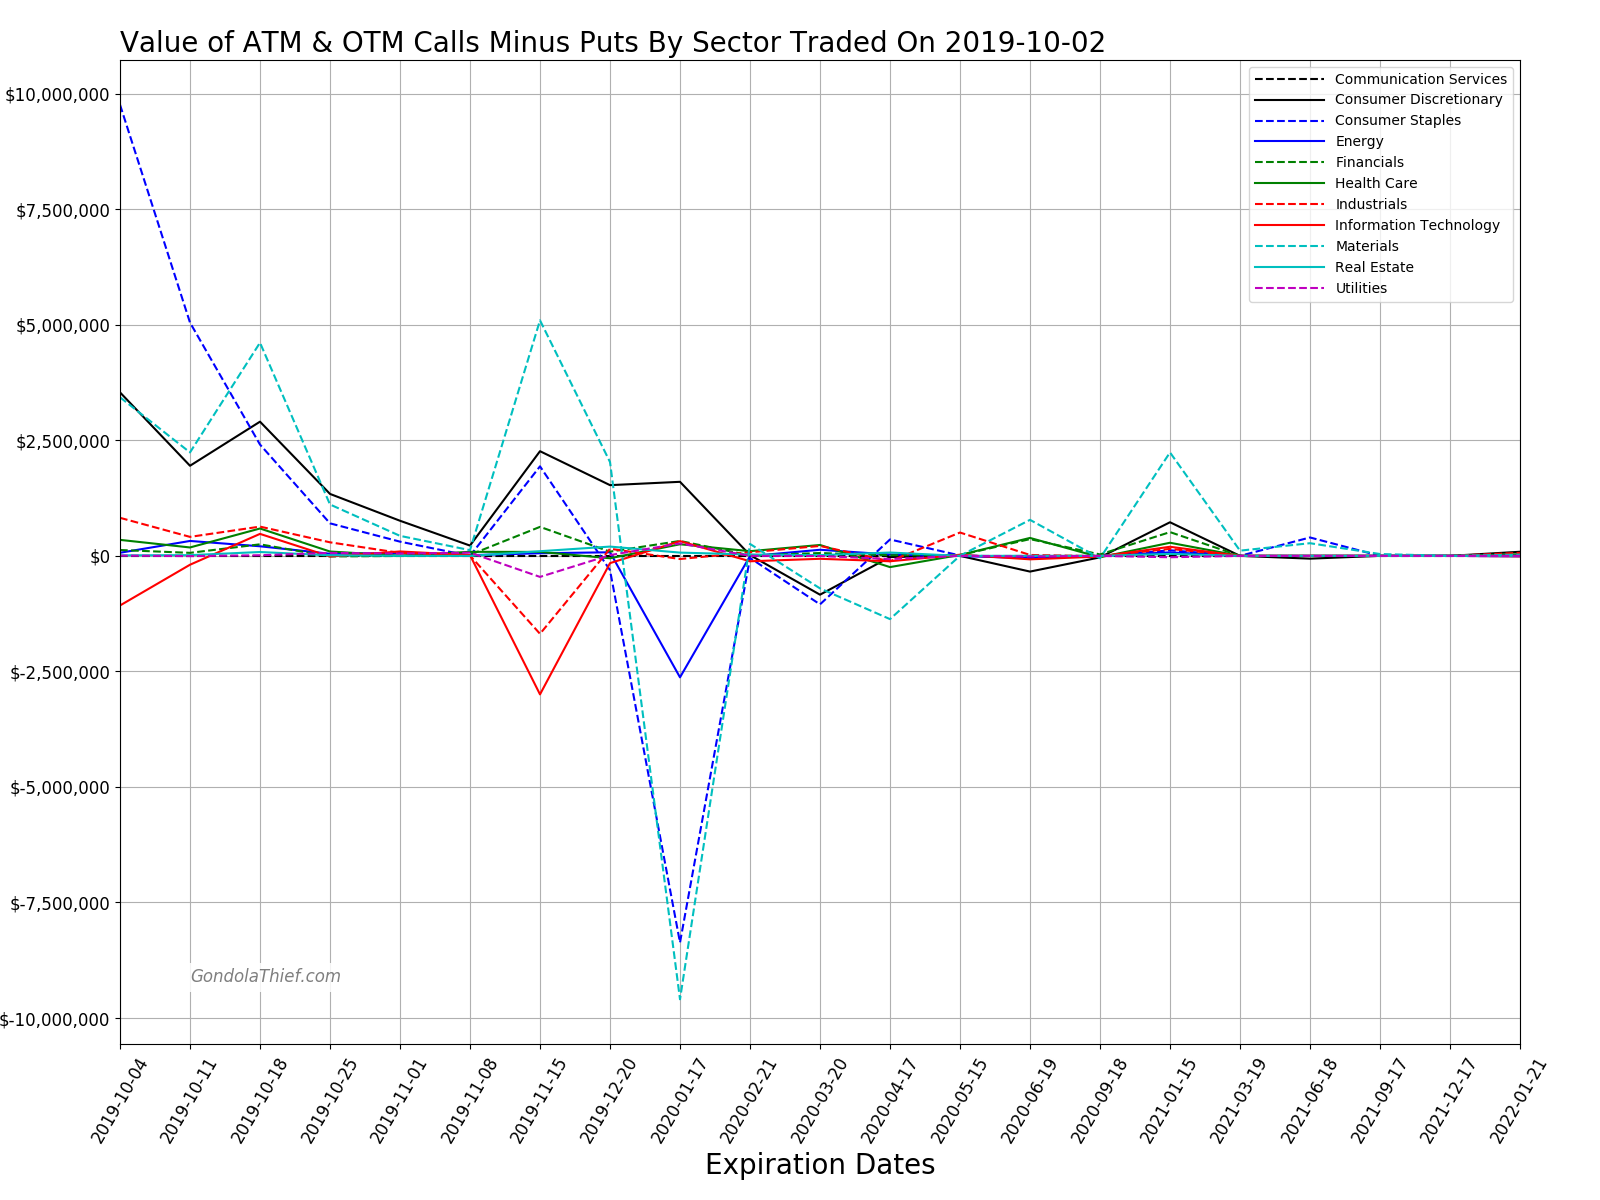
Value of atm and otm calls minus puts traded by sector
Total value (appx) of all Calls minus the value of all Puts for ATM & OTM contracts traded per sector and expiration date
Back to the top
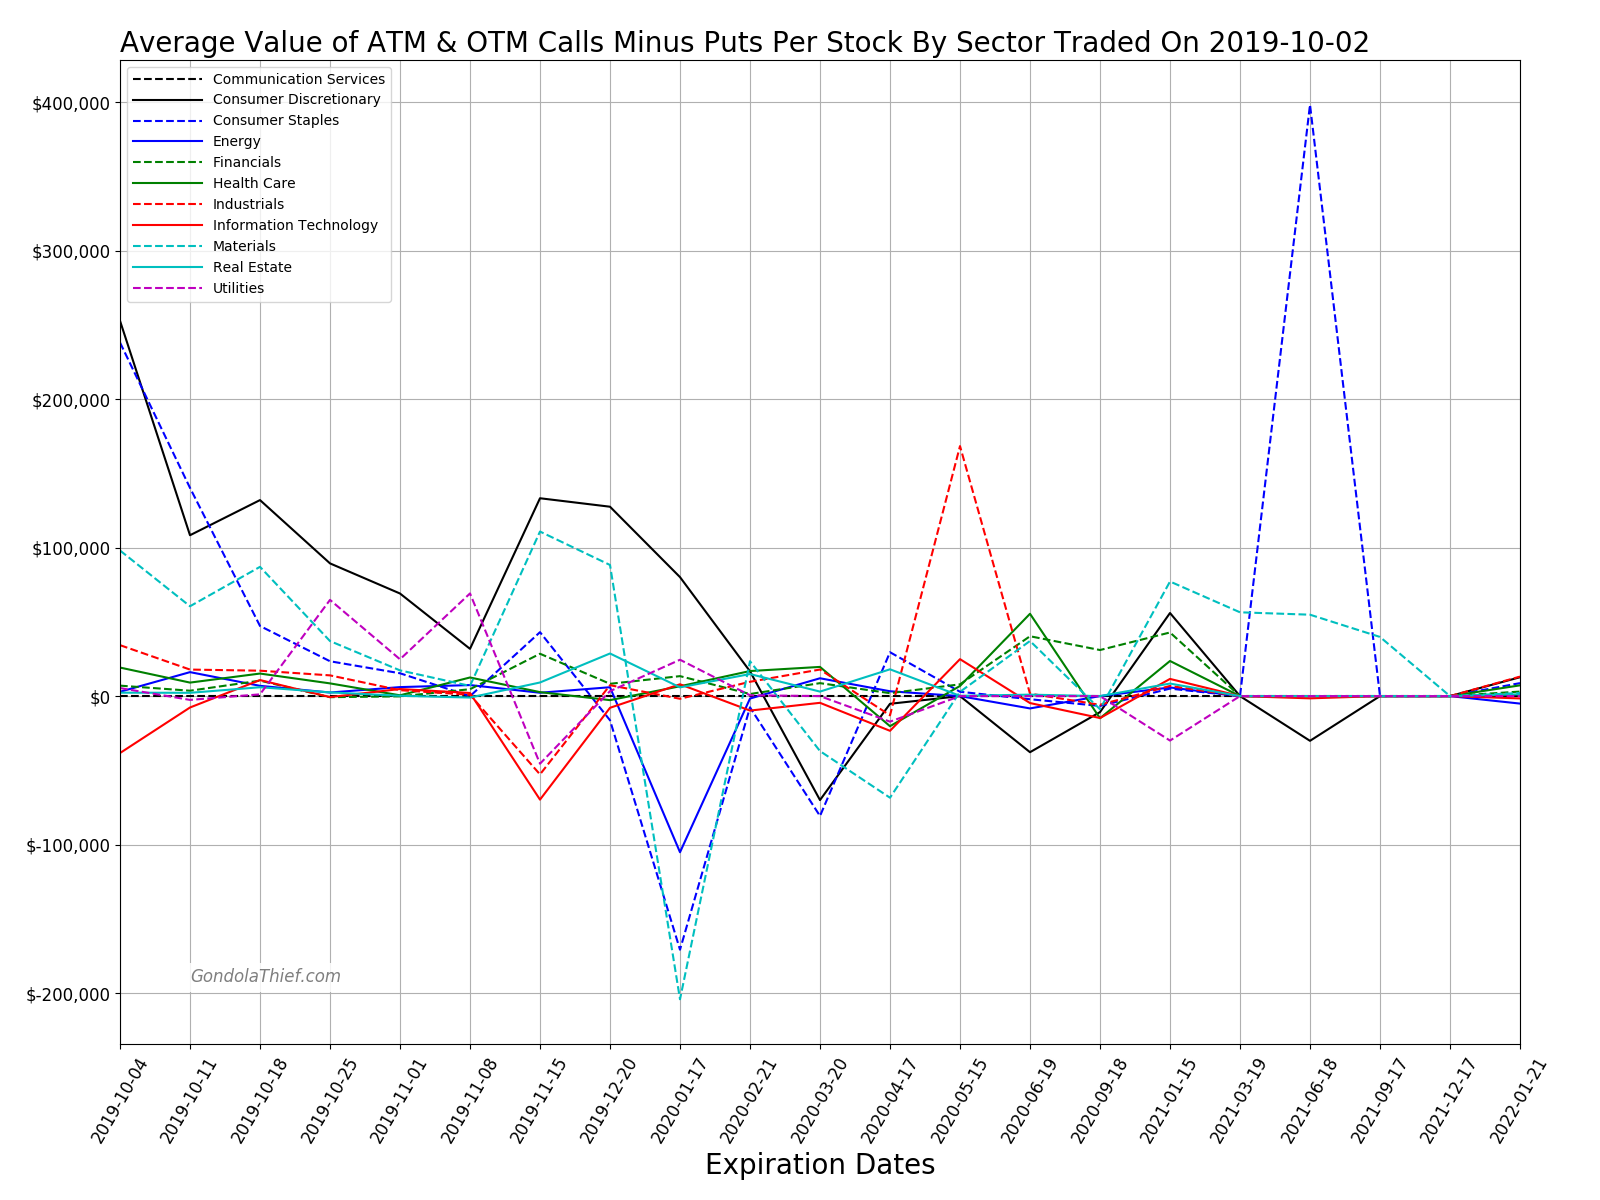
Average value (appx) of all Calls minus the average value of all Puts per sector stock for ATM & OTM contracts traded per sector and expiration date
Back to the top
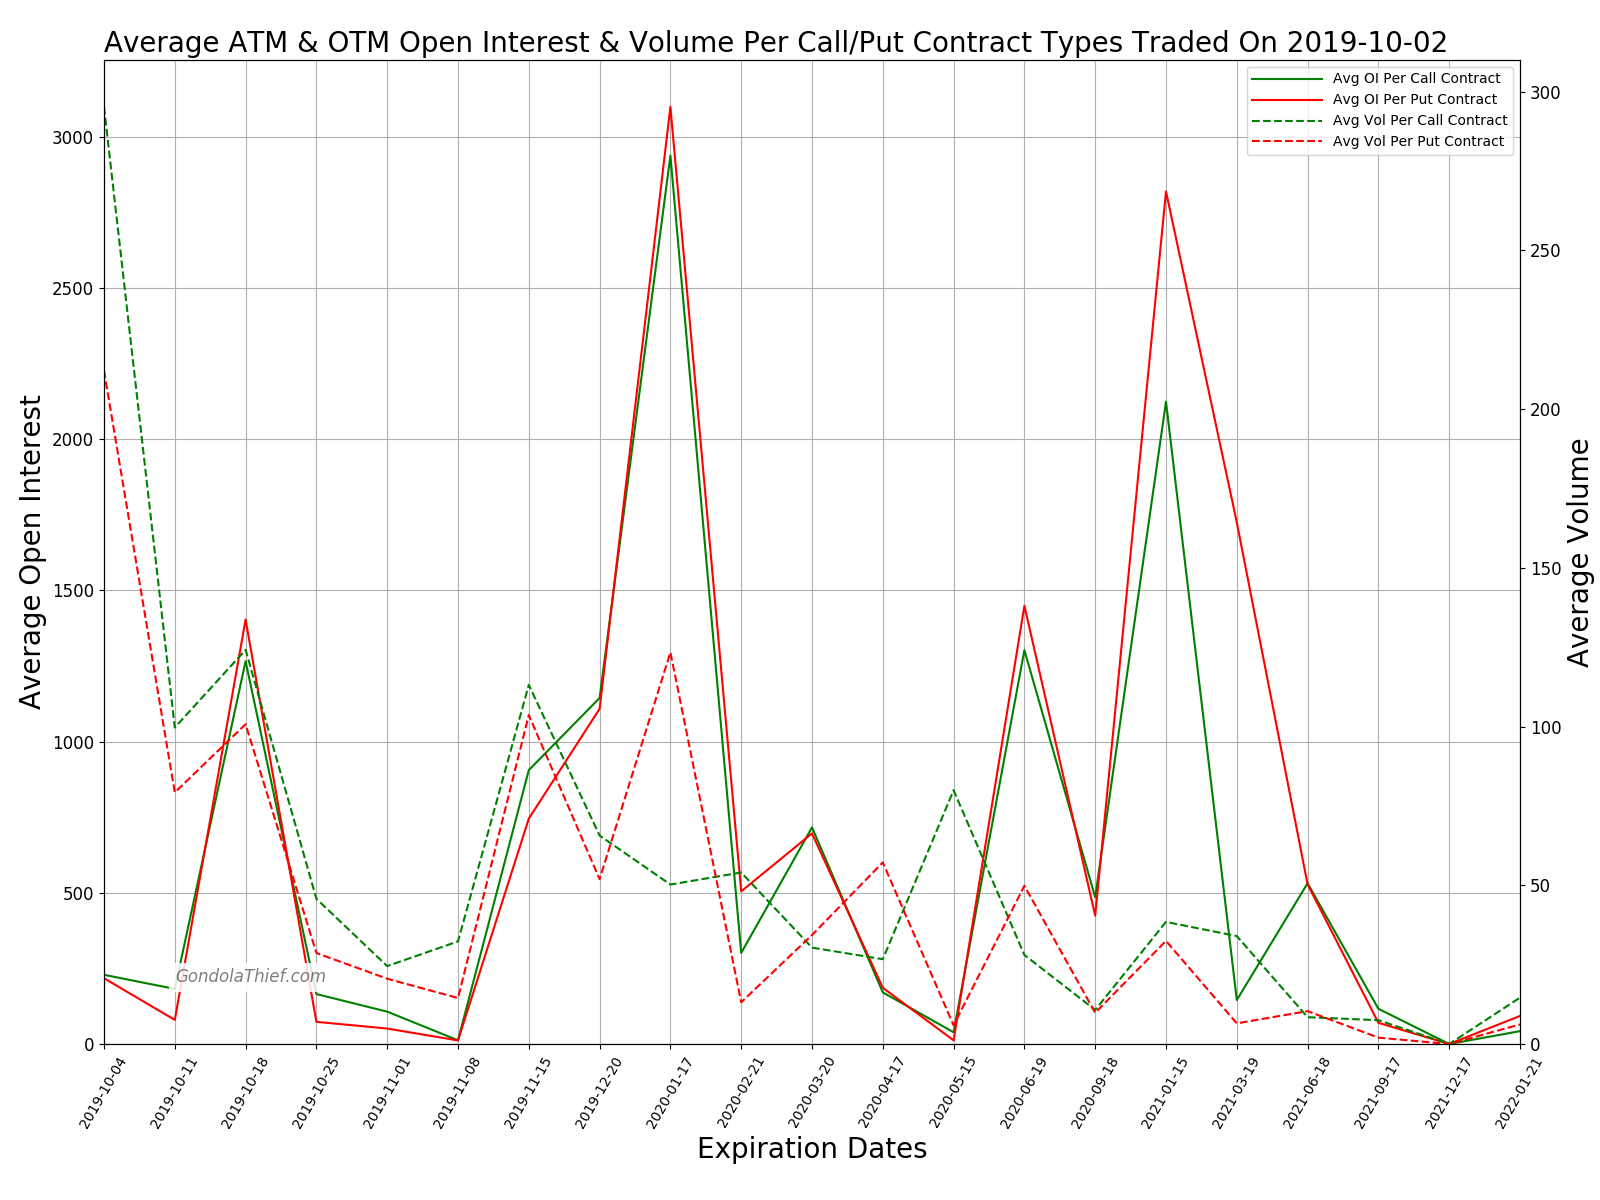
Volume |open interest of atm and otm calls |puts traded
Total volume and open interest of all ATM & OTM Calls and Puts traded per expiration date
Back to the top
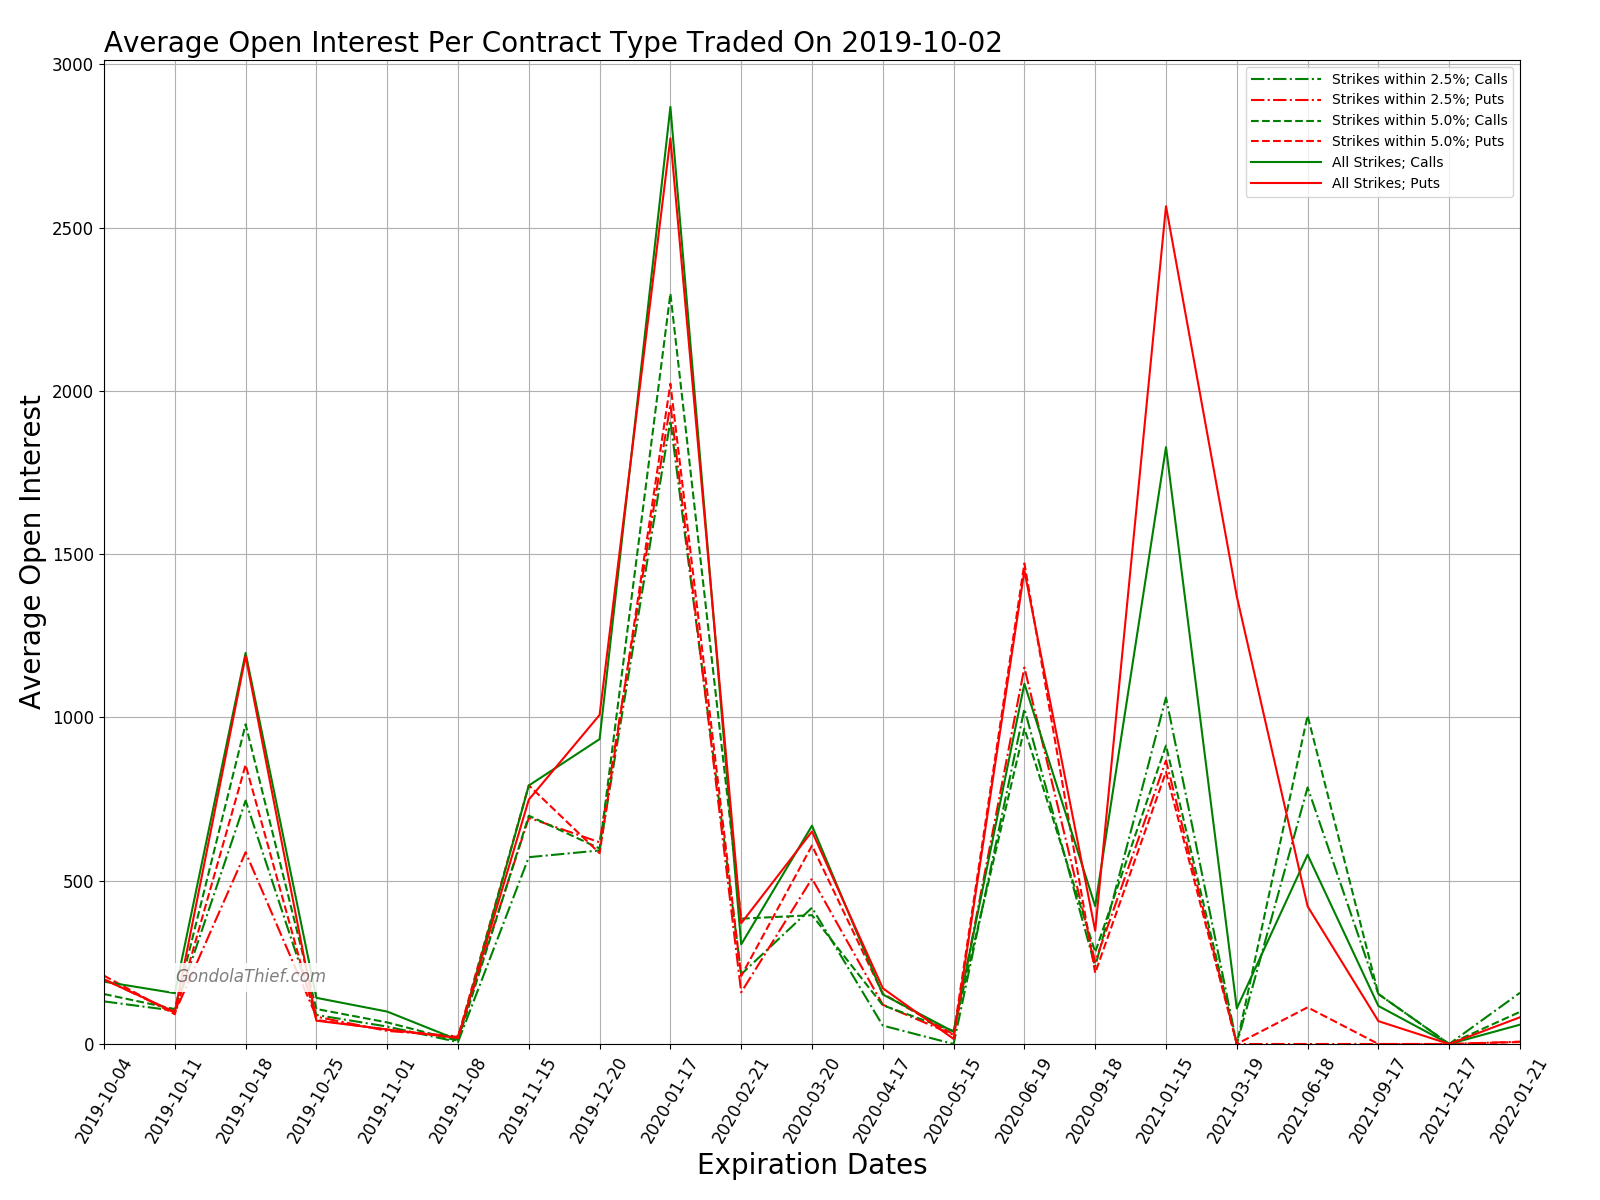
Open interest
Average open interest per stock for Calls and Puts with strikes various distances from their underlying asset's last trade per expiration date
Back to the top
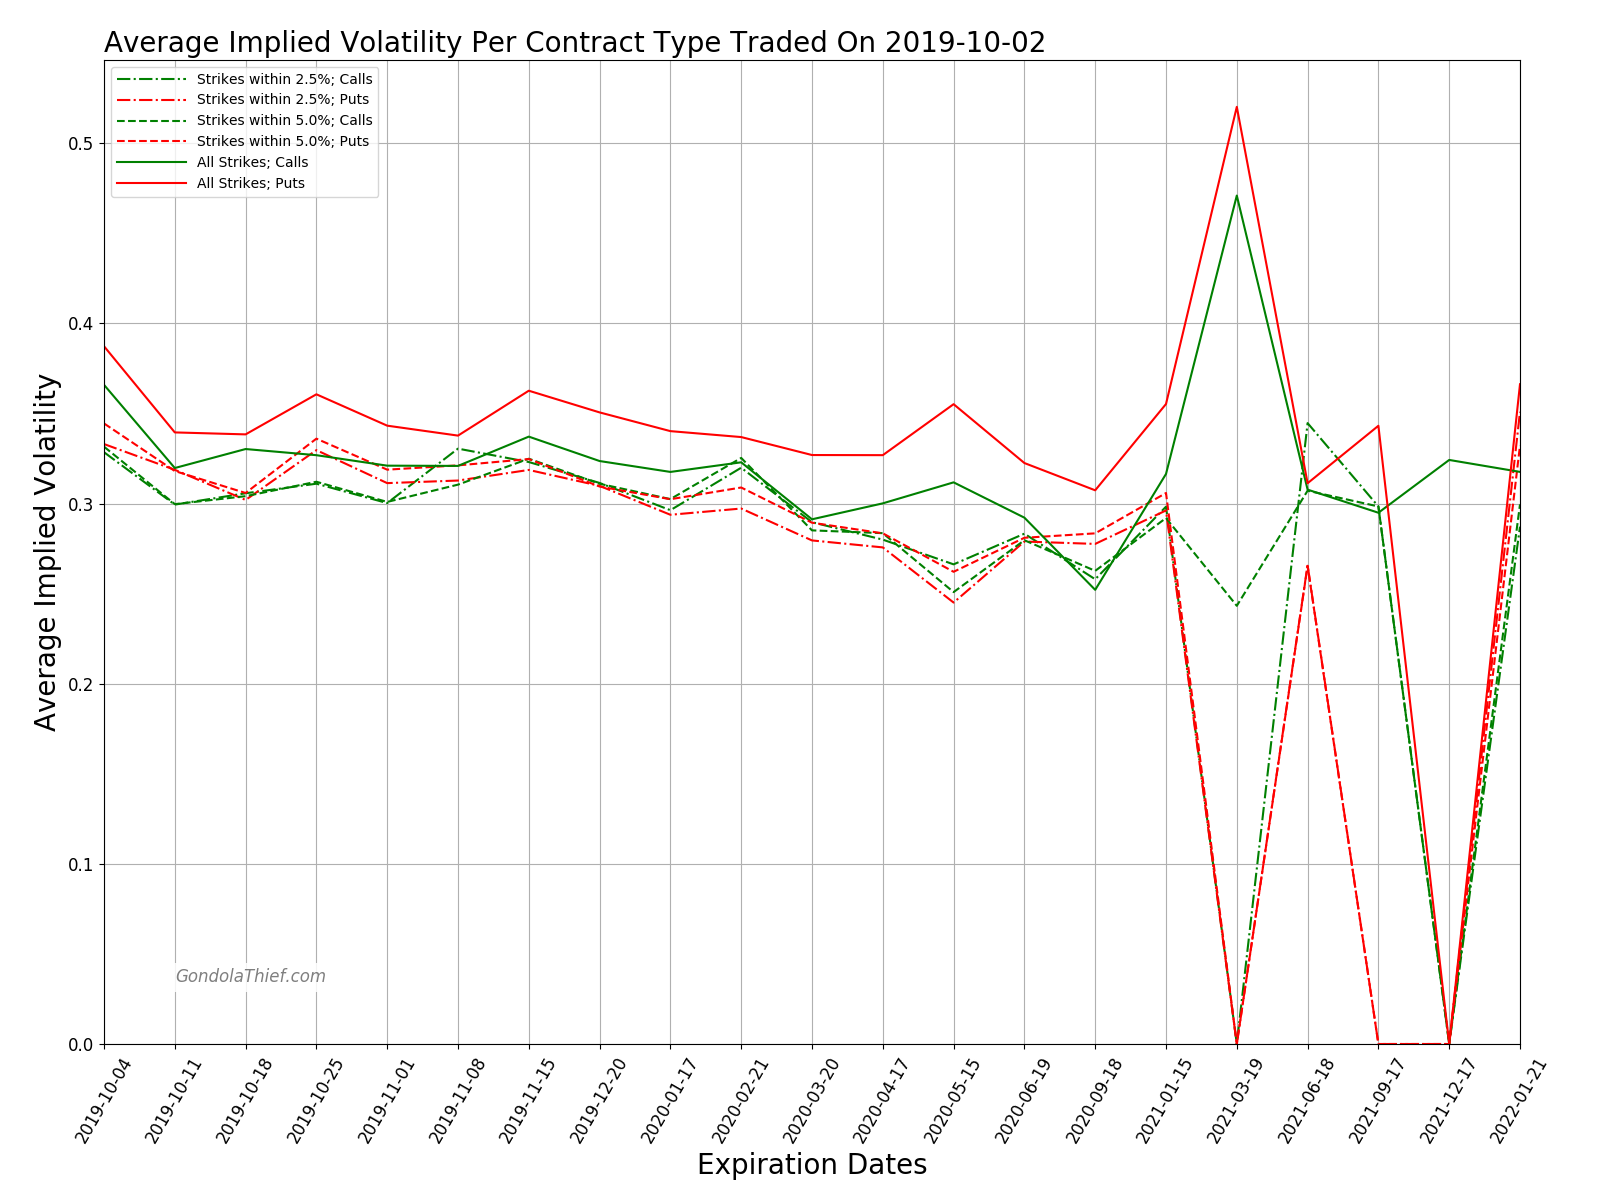
Implied volatility
Average Implied VolatilityA measure of the degree to which the market perceives an underlying asset's price will move before expiration date as otherwise chiefly determined by the trade price of its option's contracts per stock for Calls and Puts with strikes various distances from their underlying asset's last trade per expiration date
Back to the top